Conferences/Training

ECIS Panel Discussion – April, 2012

Initial thoughts:


The initial question posited to the conference panel that I’ve been asked to address:

Information Technology in school – Does it improve  learning?

Gathered some resources to begin to address this question and related topics:

https://www.evernote.com/pub/chinazurfluh/technologyitems

The key issue associated with answering the question revolves first around how you define improving learning.  The learning targets that are currently accepted often revolve around norm referenced test scores because of our reliance on these measures to show growth or performance against a larger data set.  There is some validity to this because of the large data set available after decades of using these measures and the large body of experience with these measures.

However, these kinds of measures are ill prepared to measure 21st century skills.  They effectively measure math, reading, writing, and core knowledge competency, but they do little to measure attitudes, intellectual processing skills, and skills revolving around independence, collaboration, and innovation.  We have scores of examples of students who are truly gifted as leaders and complex thinkers that routinely scored below average on the accepted measures.

So, if you are asking me whether information technology improves learning, I would have to answer “No”.

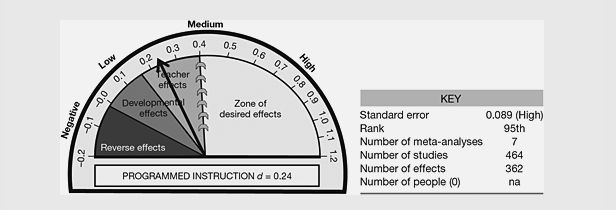
There is no clear empirical evidence that information technology as an independent variable has a correlation to improved student learning as a dependent variable in the traditional, measured definition of the term.

I would suggest that addressing this question from a quantitative point of view is faulty at the outset.  This is the same logic that has led to American ignorance of the impact of poverty on education and learning.  We’ve spent more than a decade comparing our results to international measures only to ignore how poverty has impacted our bottom line.  A recent AASA blog entry highlights the fallacy of the standards movement to address educational reform while ignoring this poverty gap between the countries (e.g. Finland with 4% in poverty vs. U.S. at 21%).  Quantitative measures are insufficient in addressing complex issues.

Logic confirms that If we want to address what technology enables, we need different goals for education.  In the truest tradition of backward design, it begins with this question:

What world are we preparing kids to live in?

Addressing that question and looking at essential skills for a 21st century world is where we truly should be focused.  In regards to this question, the next logical qualified questions is:

Does the use of information technology in schools prepare kids for a technology rich world we can scarcely describe in the current moment?

Then the answer would be a resounding and passionate — YES!!  Now let’s design and build measures for addressing skills that emerge from this backward design and use measures that are meant to really test whether students are developing 21st century skills.  Let’s get beyond the issue of technology as an entity and look at how we create technology rich environments that eminently prepare students for the world of their future.


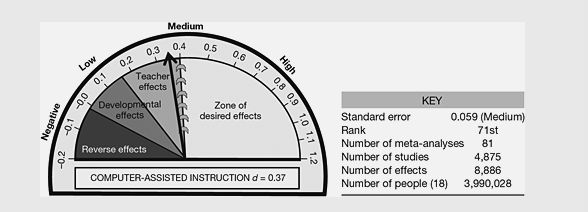
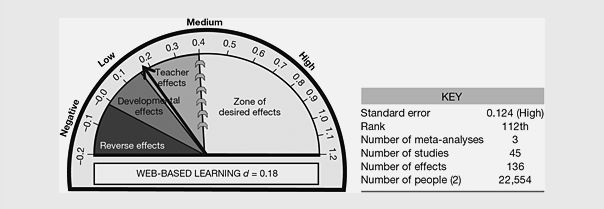
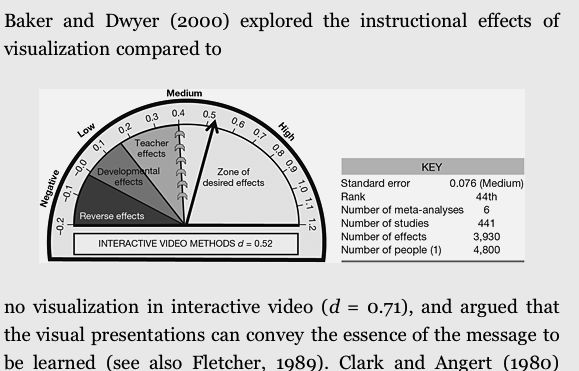
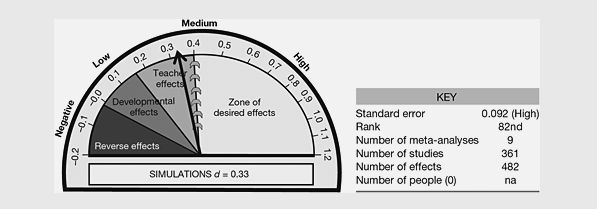
Hattie research:

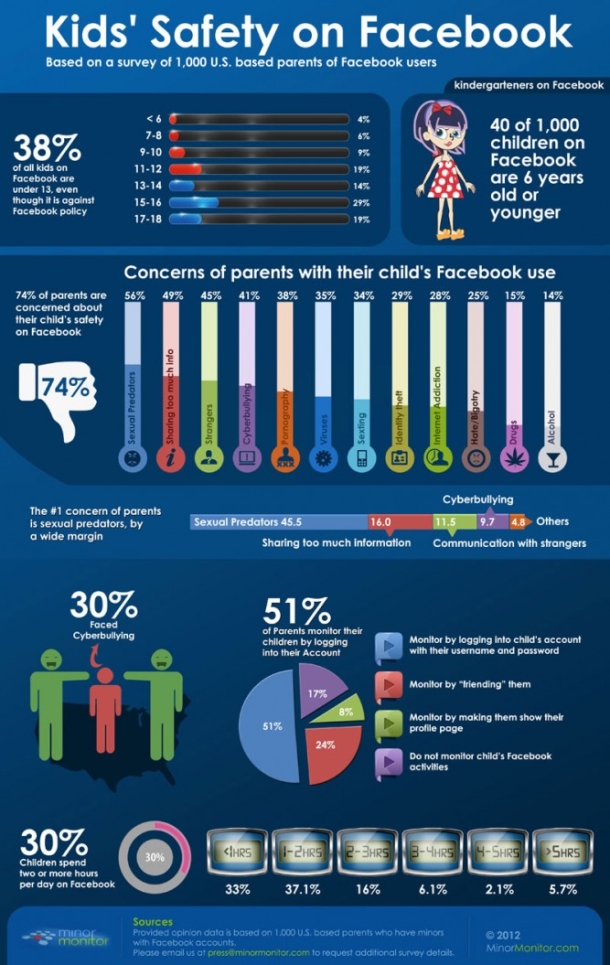
and one recently reported danger from CNET:


Learning 2.010 has launched!!

Jeff Utecht is being a bit pessimistic with his description of the recently launched third iteration of the Learning 2.0  conference series. Despite his apprehension, there is every reason to believe that this conference will again inspire and direct individuals along the path of creating the next generation of learning practices. Inspired by a collaboration of like-minded individuals in 2008, this conference continues to elicit strong gains in applying technology based practices in real learning environments. We have changed practices through our efforts, and yet we are still struggling with the degree to which that change continues to be hampered by politics and outdated pedagogy.

Thus, we offer the latest iteration of 21st-century thinking and give you the new and improved Learning 2.x. The focus this time will be on research-based practices in providing for sustainability through development of long-term relationships in cohorts of like-minded individuals. Of particular excitement to me is the opportunity to coordinate the leadership strand. Applying theory and leading-edge concepts on school change with a cohort of individuals responsible for implementing that change is an exciting and energizing venture. If everything comes together as planned,  there will be opportunity prior to the conference to build an essential common framework upon which our conversations will emerge. These personal learning networks (PLN) will continue through and beyond the conference and provide a significant foundation for future collaboration and support.

How can you not get excited about something like this?!

Take a look at the website and consider joining us in what ever cohort strikes your fancy. Personally, I hope you will consider the leadership strand. 😉

http://www.learning2.asia/

Dashboards in Schools

I recently had a verbal and email dialog with a colleague on the transplanted Business Intelligence concept of Dashboards.  Essentially, this concept revolves around how to keep leadership informed on key elements of organizational success so that strategic decisions can be made in a timely and efficient manner.  In schools, the focus shifts more to keeping elected or perpetual board members informed of school “status” with regards to all of the metrics we typically use to describe finance, learning, and accomplishment of strategic initiatives.  This email is my online brainstorm of the data side of how we change the face of school management and the measurement of stakeholder satisfaction.


My thinking has been around translating the corporate model of dashboards (see Business Intelligence) into something that might work for education.  I’ll explain a little bit to see if we are on the same page and then you can help me push the envelope.  I’m, of course, also thinking about this from the technical side.  I don’t have a specific engine yet, but the theoretical models are forming and my database people assure me that they have code ideas to back this up.Here’s what I’m dealing with relative to my board and why I’m looking at this to answer their questions and keep them informed as we grow.Budget – I’m trying to get my board to see the big picture on budgetary concerns, so I see models for broad brush looks at budget and expenditures.

Broad based totals in simple mathematics – I’d also like to converge this with a timeline function so that historical data is available.  E.g. – I see a drop down list to select a month and have expenditure bars grow or shrink according to the budget year.  Thus, capital expenditures will likely show early expenditure vs. salary which is pretty even vs. supplies which will likely be somewhere in-between with a bit of frontloading.  For each stage in the process, there would be trendlines that would then adjust based on the most recent data.  This trend can also be based on encumbrances if your financial system supports this.  For far reaching examples of data/time analysis, you should look at http://www.gapminder.org/world/ data – Think of this example using admission data.  Again, I’d like to look at trend line data like the gapminder example.  With current database information from our student records system, it shouldn’t be difficult to develop a similar interface.  This would show grade level and gender components with overlays for nationality and other factors – all generally available depending upon how you do your archive data.  It looks like Google bought this engine from them.  It’s called Trendalyzer.  Also, look at www.swivel.com for another example of live charts.

[New note:  Power School (Pearson) has a dashboard component for their school management software.  Very nice widget oriented approach.  According to sources it was just released recently as part of PS Premier 5.1.2 – (info & here).]

Engagement data – based on scheduling components. I’d like to show engagement data that identifies staff contact time with students.  So for any moment of the day, you can see what percentage of staff are engaged in scheduled activities.  This is an important one for my board as they have high expectations for this.  Besides a time based method, there would also be totals and summary methodologies. 

Project data – this is a Gant style, but it shows summary positioning on action plans – this would be RSS style with percentage complete and upcoming milestones.  These would update on daily or weekly basis and could be linked with any flavor of project management methods or just regularly updated static data.  Milestones and statements of progress could be simple blog style posts.

Satisfaction data – student/parent – We have been moving toward more online survey data collection recently and I have been considering that single event data collection seems inadequate to guage progress over time. Recently, I went through immigration at Shanghai airport and found that they had installed customer satisfaction data collection units at each passport processing counter.  The unit flashes for individuals to offer their feedback to the officer in the form of smiley face options.  You’ve probably seen these.  Although I’m not interested in mounting these on the teacher’s door (although that’s an interesting thought), I have been conjecturing about more regular single or small “dipstick” survey opportunities on our parent website and via email polls.  This process can be automated based on random selection at login or randomly sent emails so that data collection for randomly selected segments of the stakeholders is relatively constant and ongoing.  Where the dashboard comes in is relative to real time updates of this data based on submitted results.  A thermometer, if you will, of sentiment.  The data and questions could be focused around various aspects of school operation.  It could be grouped or sourced from all stakeholder groups.

Assessment data – this one is trickier, but could work based on compilation of assessments if a scale score can be derived, or if some other type of norm referencing is used.  This could also be centered around criterion referenced tools.  Summary data would show trends, again, over time.

I’m still thinking about other metrics that can be gathered over time more or less automatically.  We always seem to have a wealth of data, but we’re never sure where to put it.

The work on the website components for this likely exist in a combination of open source projects (about 20 of them in current development on Sourceforge) and a variety of BI off the shelf packages. 

Here’s one example of an open source option:

http://spagobi.eng.it/ecm/faces/public/guest/home/solutions/spagobi

There are many others.

That’s what I have.  I’m interested in this, but I’m time crunched right now.  Lot’s happening here, but I do have some people to explore this further. I’m looking for cost effective solutions (read – free) to turn the data into something usable.  I’m still forming my thoughts on this a bit and continued dialog might help push me down a certain path.  I could also see EARCOS playing into this for regional based data warehousing and cross organizational trend analysis.  I am also trying to think of options for the Learning 2.008 conference that might start a more productive dialog on this topic.